


Zoho Analytics Key Features in Brief
2021 has been a fantastic year for our customers and us. We witnessed the transformation of Zoho analytics into a modern, self-service via an analytics platform with the announcement and launch of Zoho analytics 5.0. While we look forward to providing you with an even better analytics experience in 2022, here’s a quick rundown of the top 40 features in Zoho Analytics 5.0.
Zoho Analytics 5.0
It’s important to deliver self-service via an analytics capability to any business user. Be it a business user, seasoned data scientist, data analyst, or c-suite executive. So, it’s all about democratizing analytics and not limiting it only to teams of developers.
Zoho analytics BI vision is predicated upon three foundational pillars: data management, visualization, and analysis insights and actions. Well, Zoho analytics have carefully blended Ai and bi capabilities across the bi workflow highlighted above.
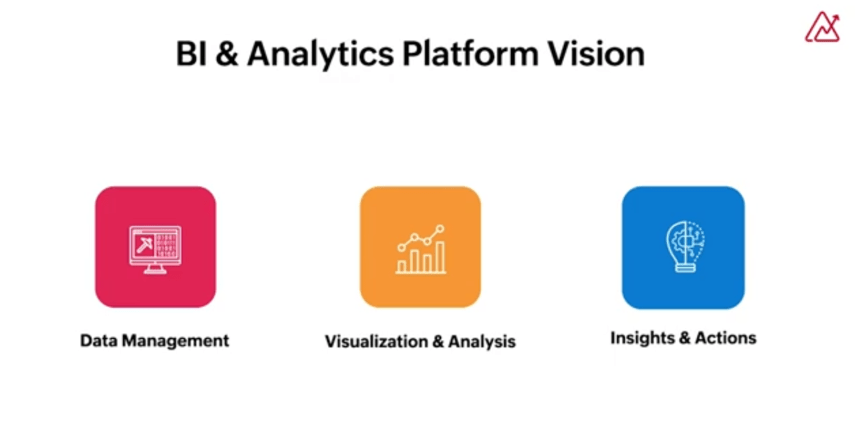
Data Management
It’s important to ingest data from a wide range of sources. Modeling data in an automated manner enables people to clean their data, transform It, enrich it, and catalog it before moving to the next bi-layer, visualization, and analysis. Once the data is prepared and cataloged, a bi platform must enable a business or technical user to interact with the data to create their reports and dashboards using intuitive features like drag and drop or the NLQ engine built into platforms.
Visualizations
Visualization allows users to enable, interact and explore data for more practical analysis.
Insights and actions
A bi platform must allow proactive analysis by providing suggestions based on meta information and historic data, either heuristically making provisions for such capabilities. The platform should also enable people to trigger actions from the platform within the platform in the context of your bi workflow.
Crystallizing the Essence Of 5.0
Zoho Analytics has beefed up its capabilities across these four areas.
- Self-service data preparation and management capabilities.
- Augmented analytics capabilities.
- Innovative ingenious ways of narrating your data stories.
- Multiple marketplace apps.
About Zoho Analytics
A quick introduction to Zoho Analytics is a self-service bi and analytics platform launched in 2009 as one of the Pioneers in the self-service bi space today. Zoho analytics enjoys the Loyalty of more than 10,000 customers, with more than 2 million happy users spread across 150 countries. With Zoho Analytics, you can ingest your data from more than 250 Plus data sources in the form of C files, feeds, local databases, Cloud databases, and popular business applications. With all that data inside Zoho analytics, you can visually analyze them in the form of reports and dashboards.
Zoho analysis offers a set of pre-built reports and dashboards with select business applications that helps you get started Instantly. Additionally, you can customize your analytics with the intuitive drag and drop feature, or the ML-powered AI assistant can get you insights faster. Zoho Analytics also enables you to visually analyze your data in more than 50 ways in the form of pivot tables, charts, dashboards, KPL widgets, and much more.
You can also easily collaborate with your team; you can have these reports and dashboards embedded inside your blogs or Internet portals with fine-grained access controls that ensure secure collaboration. You can have them up and running on big screens in the form of slideshows, and also the contextual commenting feature helps you to collaborate in the context of your analytics workflow.
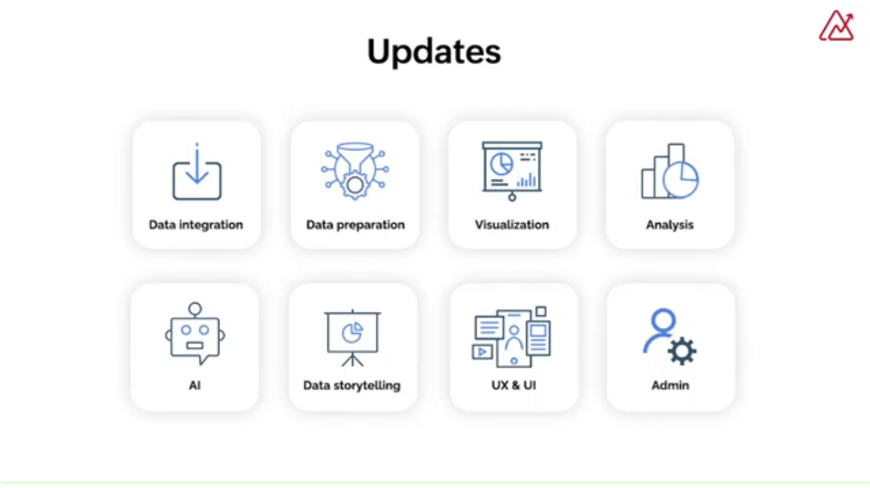
Data Integration
In 2021, we witnessed a stream of business app Integrations. There’s deep in project analytical capabilities, sales analytics, marketing analytics, e-commerce IT, ER analytics, and much more. E now natively Integrates with Jira, Woocommerce, LinkedIn Pages, Servicenow, Exact Online, Zoho Begin, and Zoho Sprints. We have added more than a thousand pre-built reports and dashboards across all these connectors. You get domain-trained ai and ML models for each of these connectors trained for each particular domain.
Data Integration also features the following
- Live Connectors
- Import Multi-org finance data
- New Modules – ZCRM Integration
- New Modules – Zbooks integration
- Import Data From Another ZA workspace
Data Preparation
Zoho data prep was launched as a part of Zoho analytics 5.0. In July 2021. It has built-in data preparation capabilities inside Zoho analytics in the context of your analytics workflow.
You can prepare your data in the context of Your analytics workflow while you’re trying to import your data. The platform will understand your data and give you a data set quality. You can run multiple Transformations, clean your data, prepare your data. Zoho data prep is available as a stand-alone data prep Studio, and it’s also available inside Zoho analytics. You can now integrate, model, clean, transform, enrich and catalog your data before moving it to the analytics layer.
Visualizations
Zoho analytics introduced a set of new visualizations. You have the word cloud chart that helps you analyze the frequency of words appearing in your data set. There are background images for geo Maps. There are now three types of dial charts, simple dial charts, speedometer dials arts, and conditional dial charts.
Analysis
Zoho Analytics has built a cognitive intelligence into its product that helps you analyze descriptive text. The platform intelligence can scan and read and understand the tone of these strings and can tag them as positive or negative. A typical use case is when you want to analyze your Twitter tweets, this can come in handy. Zoho analytics now support forecasting models that accelerate seasonal trend losses, decomposition, regression, and Arima. Using any of these models, you can analyze your data. Depending on your business needs, you can choose any of them, or otherwise, you can let the platform decide the best model for your data set by picking the best feature for your analysis.
AI
Zoho analytics introduced something called ZI insights. ZI insights are automated insights that feed you with more insights than those you can extract from normal visuals. At the click of a button, you get these automated insights. So, this eliminates exploratory analysis and helps you get more insights at the click of a button with zero chart interactions.