


Businesses today face an imbalance caused by the growing complexity of data ecosystems and the rapid adoption of bi. How are companies across the globe working to overcome this imbalance and drive growth?
This article will discuss how KPI dashboards are becoming a solution to this imbalance and transforming into indispensable business enablers. KPI dashboards help you empower teams across your organization to make better business decisions.
We will get started with the information ecosystem, where we will explain the dumbbell model
The Dumbbell Model
You have data flowing into your business, and you have data flowing from your business are you harnessing that data? That brings us to the importance of building a robust information ecosystem to handle data efficiently. It’s important for businesses to build an information ecosystem that can help organizations harness the power of data.
As far as an information ecosystem is concerned, there are three questions to ask.
- Why is an information ecosystem important?
- How do you sustain an information ecosystem once you have it in place?
- What next?
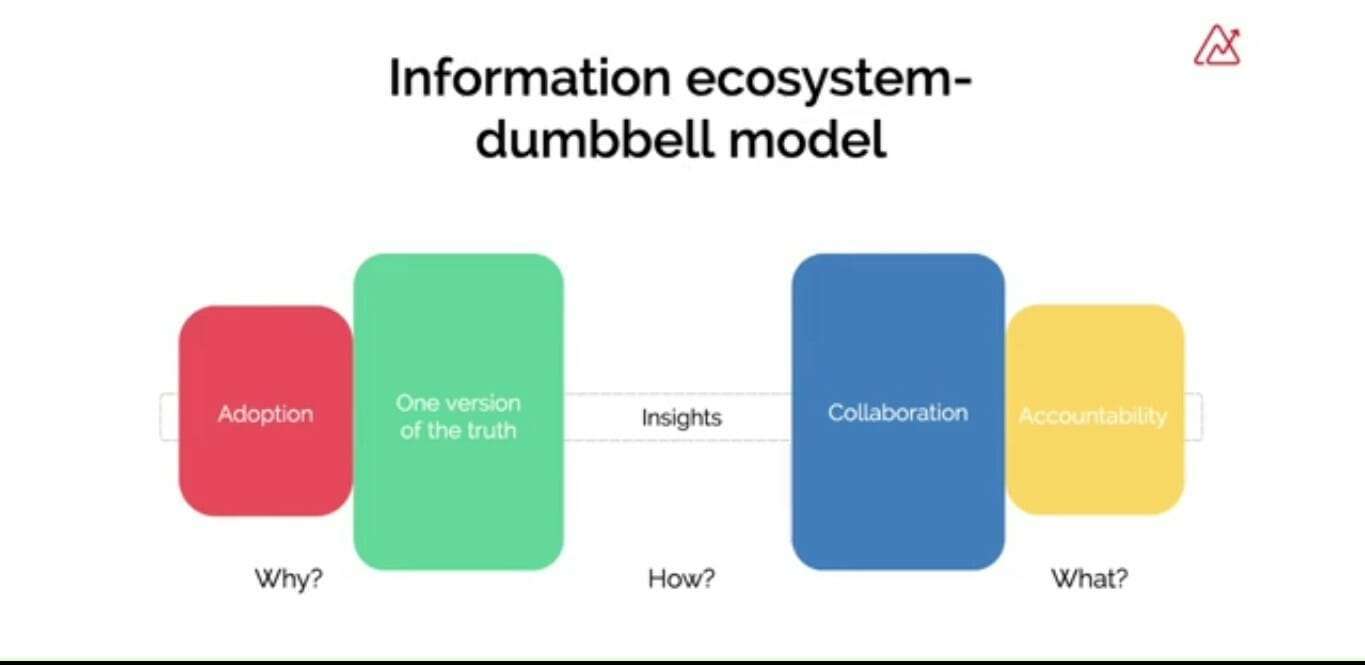
The dumbbell model is one such framework that helps you answer these three questions in helping you build a robust information ecosystem for your businesses.
Today, we are witnessing a spike in the adoption of analytics and bi platforms among business users. Organizations’ adoption of multiple business applications drives the need to have a single version of the truth by constantly feeding teams with insights. You need to build a system that enables collaboration among teams within your organization. When all these elements are put together to build an ecosystem, you build a system that builds accountability within your organization. These are the five essential components that you need to consider if you want to build a robust information ecosystem.
Now, let’s get a little granular in understanding each of these before we jump to a walkthrough. Let’s get started with
Adoption
Organizations are gradually moving away from an impulse-driven decision-making framework to a data-driven decision-making framework that further drives the adoption of bi and analytics among non-tech users. Today, analytics and bi are not limited only to senior executives or managers. You also have a wider group of audience being serviced by these applications.
You have to build an ecosystem that meets the needs of non-tech users. Today, however, there’s a tog of war between cell service and technical know-how that’s building a lot of dependency on its teams. This further leads to siloed analysis and encourages human dependency to construct an information ecosystem. The essence here is how to satisfy the data needs of non-tech users. If we are able to conceptualize our information ecosystem on these lines, you might end up building a robust system.
One Version of Truth
There are multiple known and unknown variables operating within your business and outside your business that affect your business’s performance. It’s important to understand the correlation among these variables, which enables cross-functional analysis. Given the pandemic, we are witnessing a surge in the adoption of business applications by organizations. It’s important to have end-to-end inside happening across your multiple business applications.
Today, however, there are multiple unconnected sources within a company with various teams working on ad-hoc applications, and the need for technical know-how is further limiting the scope of work by localizing your efforts.
If you are able to do that, you will probably land up having a single version of the truth with that. We are moving to the aspect of sustaining your information ecosystem, and that’s by constantly feeding your teams with the relevant.
Insights
You need to build a system that helps your teams quickly and precisely track KPIs that will enable them to respond to changes quickly. Build a system that helps them slice and dice data and analyze them from multiple dimensions. Today, siloed analysis leads to a unidimensional approach to analyzing data, and the silos also create scattered insights.
Collaboration
Teens need to be on the same page, and data transparency is critical in determining teams’ success. It is important to make your metrics available on demand. Today business decisions are not made in just one single step. It’s important to empower your teams with contextual insights at every stage of decision-making, and this ecosystem that you build should feed them with contextual insights at every stage of decision-making.
Your system should facilitate real-time collaboration among teams. You also need to eliminate long and inconclusive meetings and lag in communication.
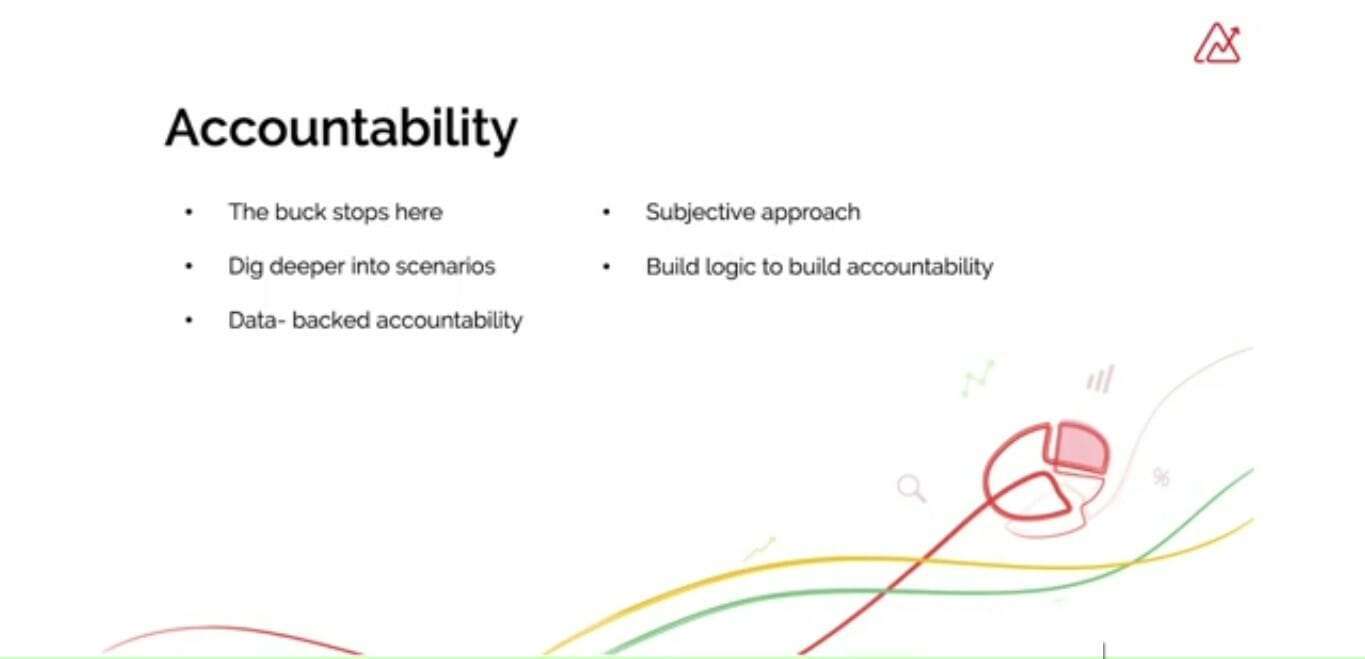
Accountability
With the system currently in place within your organization, can you confidently say that the buck stops here? Are you able to dig deeper into scenarios to find out the root causes of the problems? Are your teams building accountability that’s backed by data? Today teams have a subjective approach toward building accountability, and surprisingly teams build logic to build accountability.
But how do we create a single platform that provides accountability? That enables data-driven accountability across different teams within your organization? This explains the theory of building a robust information ecosystem within your organization, so you got to empower business users who are adopting business intelligence and analytics tool.
How Do We Build This Information Ecosystem?
Dashboards will help you build a robust information ecosystem within your organization. Let’s see how Gardner defines a dashboard. Dashboards are recording mechanisms that aggregate and display metrics and key performance indicators of KPIs—enabling them to be examined at a glance, by all manner, of users before further exploration via pa tools.
As leaders, it’s important to know that dashboards are of three types. Which are strategic dashboards, operational dashboards, and analytical dashboards
Strategic dashboards are designed to provide strategic guidance based on snapshots of data. Your operational dashboards offer a glimpse of the day-to-day activities of a business, and an analytics dashboard is your hands-on dashboard. Depending on the needs of your business, you can choose one of these dashboards or maybe all of them to meet your data needs or build your robust information ecosystem.