


What Are Analytics?
Analytics is the systematic computational analysis of data or statistics. It is used for discovering, interpreting, and communicating meaningful patterns in the data when you have a huge amount of data. Analytics plays a key role if you would like to derive some insightful information based on that. Analytics is the process of mining the raw data, which in turn gets converted into visualization. The visualization can be in the form of charts, KPI widgets, period tables, dashboards, and lots more. We can derive some insightful information based on these visualizations to help us make better data-driven decisions.
Zoho Analytics
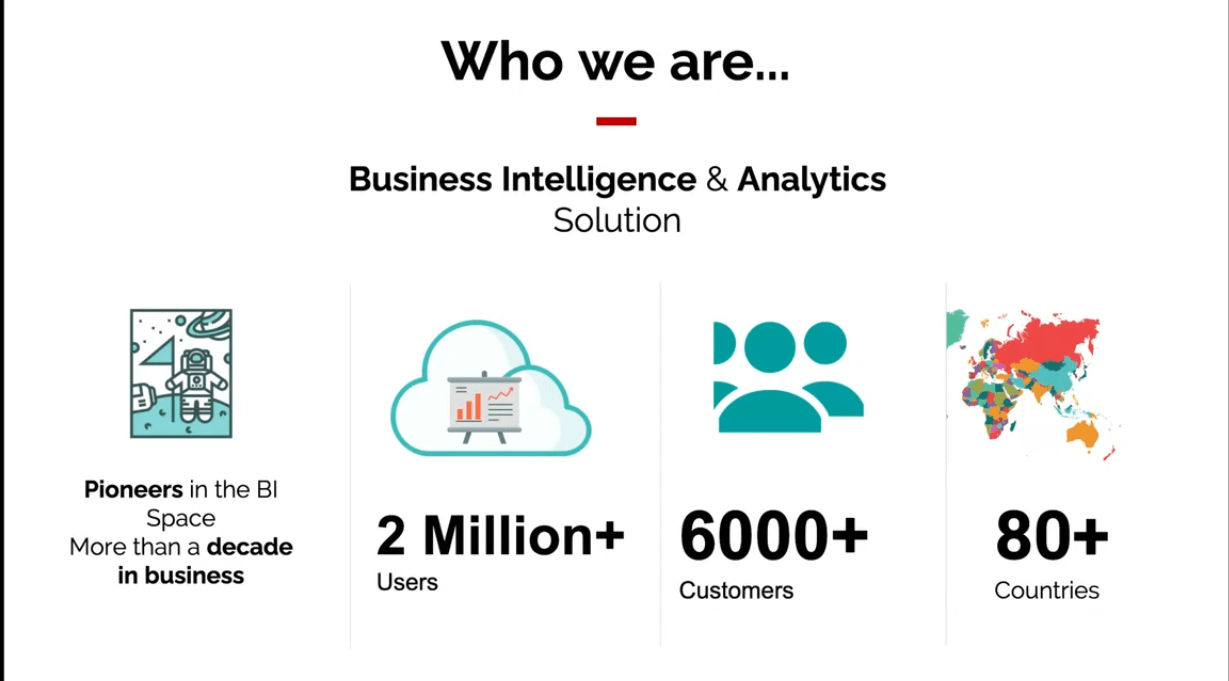
Who We Are?
Zoho Analytics is a cloud-based business intelligence tool that offers an analytical solution. Zoho analytics has been in the market for more than a decade, and we are one of the pioneers in the bi-space. Currently, Zoho analytics has more than two million active users, among which we have 6,000 plus paying customers. Our customers are situated across the globe in around 80 different countries.
Need help building powerful options to model and prepare your data?
Schedule a free consultation with our dedicated Zoho Analytics Experts!
For the good work we have been doing so far, Zoho analytics has been awarded by some of the top software and reviewers’ platforms, such as trust radius, get an app, and data crowd. We have also been awarded by the bark and the bi survey now.
Zoho Analytics Comprises Three Key Features
The first feature imports are getting the data into Zoho analytics platform. Zoho analytics allows you to import data from a wide range of data sources. Your data might be across a wide range of data sources, and the first and foremost step here is to bring the data into the analytics platform. The second feature is about creating reports and dashboards in Zoho analytics; we support a different type that is around 20 to 30 types of charts, KPI widgets, and dashboards; the third feature is collaborating. Your end user, after having created the required reports and dashboards, how to share and collaborate with your end user.
Now, let’s get in-depth about each of these features.
The First Feature Is to Import Data
As you see on the screen, these are some business applications with which Zoho analytics supports direct integration with Zoho applications like the Zoho books, CRM, desk, projects, and many more. It also supports direct integration with other business applications like stripe, QuickBooks, Shopify, and salesforce HubSpot. Apart from this, if you have your data on any social media platforms, like Facebook, Twitter, LinkedIn, Instagram, YouTube, etc. Apart from all these, if you have your data in the cloud database or local database, even in the cloud drive, you can still import the data into analytics.
Whenever you import data from any cloud-based data sources or cloud-based business application, you can also schedule this import so rather than manually fetching the data. Every time you can completely automate this process. Whenever you import data from a cloud database, local database, or any cloud-based business application, the input interval can be made once every three hours. So that is the minimum, and it goes in the range of 3, 6, 9, 12 hours, or even once a day. And if you import from the cloud drive or via API, you can also make it once every hour.
The next feature, which was going to discuss, is the visualization process. What you see on the screen is a dashboard created using the one analytics dashboard is nothing but a single-page viewer where you have multiple reports. If you look at this particular dashboard, we have multiple components, but together on the top, we have small rectangular boxes that we call widgets. Followed by that, we have a lot of report types, so you can see a line chart, funnel chart, heat map chart, and area chart along.
You can also add some pivot tables to this dashboard; by the end of this session, you will all learn how to create an insightful dashboard similar to this.
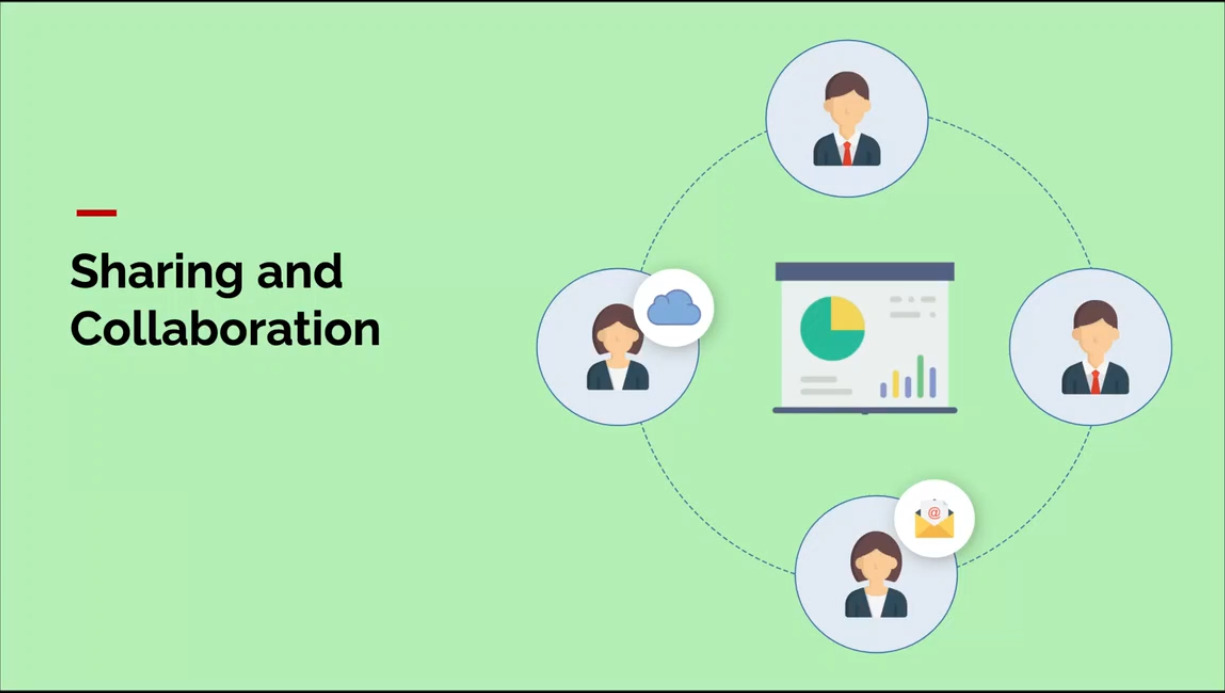
The Next Feature Is Sharing and Collaboration
Once we have all the reports and dashboards radio on hand, the next step is to collaborate with our end users in Zoho analytics; there are different ways to share and collaborate with your user. The first option is privately sharing a report or a dashboard with a user. A single report can be shared with multiple people based on multiple filter criteria; you can define the filter criteria with multiple people based on multiple filter criteria so you can define filter criteria. And also, you will be able to fine-grain the permission levels for every user. Whether a particular user can export the report order around the data, all this information can be specified when you share a report with the user.
The next option is emailing a report to a user directly from the Zoho analytics platform; it is possible to email the reports to the end user when you do this. You can also schedule this process rather than sending a report manually every time; you can set up a daily, weekly, or monthly report schedule. And more importantly, you can also specify the time zone in which a particular person belongs; accordingly, the report will get an email to the end user. The third option is embedding the reports on a web page or a blog. If you run a blog or have a web page where you want to put up these beautiful or insightful reports that use the iframe, which is over analytics generated for every report you can embed.
The last option is exporting the reports in a different form. Zoho analytics allows you to export reports in different forms such as images, CSV, HTML pdf, and lots more.
The export option varies according to the type of report you don’t export and the type of report you’re going to export.
Having Talked About Some of The Key Features, Let’s Get into The Advanced Ones
Some of the key features now, let’s get into the advanced features; Zoho analytics provides you an option to create some powerful formulas. It has a powerful formula engine to perform various calculations on your data. Also, it enables you to derive business-specific metrics or insights from complex data, which helps you visualize them as useful reports. Zoho analytics formula engine also offers you a rich set of inbuilt functions to help you to bring your metric through formulas, which will help you meet your specific analytical need. Adding to this Zoho, analytics also allows you to create query tables. We support SQL queries using which you can create any report. You can also combine the data across multiple data sources or tables and create insightful reports with the help of SQL queries. And there are a lot of SQL functions that are supported at the moment.
The next important feature which we are going to discuss now is forecasting. Forecasting is a technique that uses historical data as inputs to make informed estimates that are predictive and determine the direction of future trends. In Zoho analytics, we offer a powerful forecasting engine that predicts future data based on your past data trends.
You can set up a forecast in a chart using a very simple setup process without worrying about the underlying complexity.